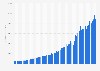
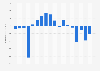
| Characteristic | Operating income in million U.S. dollars |
|---|---|
| Q1 '26 | 47,187 |
| Q4 '25 | 45,445 |
| Q3 '25 | 37,121 |
| Q2 '25 | 35,889 |
| Q1 '25 | 34,859 |
| Q4 '24 | 34,929 |
| Q3 '24 | 32,803 |
| Q2 '24 | 30,846 |
| Q1 '24 | 28,797 |
| Q4 '23 | 27,594 |
| Q3 '23 | 24,203 |
| Q2 '23 | 23,849 |
| Q1 '23 | 21,928 |
| Q4 '22 | 20,036 |
| Q3 '22 | 18,443 |
| Q2 '22 | 21,031 |
| Q1 '22 | 21,989 |
| Q4 '21 | 25,103 |
| Q3 '21 | 23,329 |
| Q2 '21 | 21,752 |
| Q1 '21 | 18,572 |
| Q4 '20 | 17,823 |
| Q3 '20 | 12,589 |
| Q2 '20 | 7,572 |
| Q1 '20 | 9,270 |
| Q4 '19 | 11,459 |
| Q3 '19 | 10,746 |
| Q2 '19 | 10,280 |
| Q1 '19 | 9,188 |
| Q4 '18 | 9,576 |
| Q3 '18 | 9,490 |
| Q2 '18 | 8,959 |
| Q1 '18 | 8,368 |
| Q4 '17 | 8,595 |
| Q3 '17 | 8,744 |
| Q2 '17 | 7,664 |
| Q1 '17 | 7,446 |
| Q4 '16 | 7,883 |
| Q3 '16 | 6,778 |
| Q2 '16 | 6,990 |
| Q1 '16 | 6,245 |
| Q4 '15 | 6,774 |
| Q3 '15 | 5,807 |
| Q2 '15 | 5,608 |
| Q1 '15 | 5,188 |
| Q4 '14 | 5,223 |
The chart is not accessible to screen readers. Please switch to the table view to access the data.
April 2026
Worldwide
Q4 2014 to Q1 2026
GAAP operating income, Google Services and Google Cloud
Google Services includes products and services such as ads, Android, Chrome, hardware, Google Maps, Google Play, Search, and YouTube. Google Services generates revenues primarily from advertising; sales of apps, in-app purchases, digital content products, and hardware; and fees received for subscription-based products such as YouTube Premium and YouTube TV.
Google Cloud includes Google鈥檚 infrastructure and data analytics platforms, collaboration tools, and other services for enterprise customers. Google Cloud generates revenues primarily from fees received for Google Cloud Platform services and Google Workspace (formerly known as G Suite) collaboration tools.