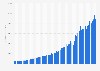
| Characteristic | Revenue in million U.S. dollars |
|---|---|
| 2025 | 48,030 |
| 2024 | 40,340 |
| 2023 | 34,688 |
| 2022 | 29,055 |
| 2021 | 28,032 |
| 2020 | 21,711 |
| 2019 | 17,014 |
| 2018 | 14,063 |
| 2017 | 10,914 |
| 2016 | 10,601 |
| 2015 | 7,151 |
| 2014 | 6,050 |
| 2013 | 4,435 |
| 2012 | 2,353 |
| 2011 | 1,374 |
| 2010 | 1,085 |
| 2009 | 761.8 |
| 2008 | 667 |
| 2007 | 181.4 |
| 2006 | 112.3 |
| 2005 | 73.6 |
| 2004 | 45.9 |
| 2003 | 45.3 |
| 2002 | 28.6 |
| 2001 | 19.5 |
The chart is not accessible to screen readers. Please switch to the table view to access the data.
Loading statistic...
Download
Source
Sources
Release date
February 2026
More information
Region
Worldwide
Survey time period
2001 to 2025
Special properties
Google other revenues, excludes Alphabet "Other Bets" revenues
Supplementary notes
Google other revenues consist primarily of revenues from:
鈥� Google Play, which includes sales of apps and in-app purchases;
鈥� hardware, hardware, which includes sales of Fitbit wearable devices, Google Nest home products, and Pixel devices;
鈥� YouTube non-advertising, which includes subscription revenues from services such as YouTube Premium and YouTube TVs;
鈥� other products and services.
Citation formats