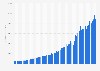
| Characteristic | Revenue in billion U.S. dollars |
|---|---|
| 2025 | 29.79 |
| 2024 | 30.36 |
| 2023 | 31.31 |
| 2022 | 32.78 |
| 2021 | 31.7 |
| 2020 | 23.09 |
| 2019 | 21.55 |
| 2018 | 20.01 |
| 2017 | 17.62 |
| 2016 | 15.6 |
| 2015 | 15.03 |
| 2014 | 14.54 |
| 2013 | 13.65 |
| 2012 | 12.47 |
| 2011 | 10.39 |
| 2010 | 8.79 |
| 2009 | 7.17 |
| 2008 | 6.71 |
| 2007 | 5.79 |
| 2006 | 4.16 |
| 2005 | 2.69 |
| 2004 | 1.55 |
| 2003 | 0.63 |
| 2002 | 0.1 |
| 2001 | 0 |
The chart is not accessible to screen readers. Please switch to the table view to access the data.
Loading statistic...
Download
Source
Source
Release date
April 2026
More information
Region
Worldwide
Survey time period
2001 to 2025
Supplementary notes
Google Network includes services like Google Ad Manager (platform for administering accounts and campaigns) and AdSense (providing text, images, video, or interactive media advertisements targeted to the site content and audience) revenues. These do not Google websites' revenues are generated directly via Google Search, YouTube ads, and others. Values for Google websites can be found here.
Values regarding 2013 and onwards have been adjusted retroactively to reflect Google segment revenue of Alphabet Inc. instead of Google's total company revenue as prior to restructuring.聽
Citation formats