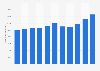
| Characteristic | Number of non-permanent residents |
|---|---|
| 2021 / 2022 | 205,238 |
| 2020 / 2021 | -42,377 |
| 2019 / 2020 | 77,344 |
| 2018 / 2019 | 168,501 |
| 2017 / 2018 | 162,290 |
| 2016 / 2017 | 103,243 |
| 2015 / 2016 | 35,752 |
| 2014 / 2015 | -16,365 |
| 2013 / 2014 | 32,867 |
| 2012 / 2013 | 49,521 |
| 2011 / 2012 | 55,414 |
| 2010 / 2011 | 14,733 |
| 2009 / 2010 | 34,243 |
| 2008 / 2009 | 71,886 |
| 2007 / 2008 | 51,478 |
| 2006 / 2007 | 27,424 |
| 2005 / 2006 | 15,978 |
| 2004 / 2005 | 9,148 |
| 2003 / 2004 | 10,348 |
| 2002 / 2003 | 36,771 |
| 2001 / 2002 | 33,510 |
| 2000 / 2001 | 39,592 |
The chart is not accessible to screen readers. Please switch to the table view to access the data.
September 2022
Canada
2000 to 2022
The following groups are referred to as Non-permanent residents:
1. persons with a usual place of residence in Canada who are claiming refugee status and the family members living with them;
2. persons with a usual place of residence in Canada who hold study permits and the family members living with them;
3. persons with a usual place of residence in Canada who hold work permits and the family members living with them.
The time period for each year is from July 1 to June 30.
Adapted from Statistics Canada, statcan.gc.ca, 2000 to 2022. This does not constitute an endorsement by Statistics Canada of this product.