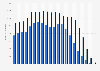
| Characteristic | Resident population in millions |
|---|---|
| 2021 | 38.25 |
| 2022 | 38.88 |
| 2023 | 39.43 |
| 2024 | 39.95 |
| 2025 | 40.46 |
| 2026 | 40.96 |
| 2027 | 41.45 |
| 2028 | 41.93 |
| 2029 | 42.39 |
| 2030 | 42.84 |
| 2031 | 43.28 |
| 2032 | 43.7 |
| 2033 | 44.11 |
| 2034 | 44.51 |
| 2035 | 44.9 |
| 2036 | 45.28 |
| 2037 | 45.65 |
| 2038 | 46.02 |
| 2039 | 46.37 |
| 2040 | 46.72 |
| 2041 | 47.07 |
| 2042 | 47.41 |
| 2043 | 47.76 |
| 2044 | 48.1 |
| 2045 | 48.44 |
| 2046 | 48.77 |
| 2047 | 49.1 |
| 2048 | 49.43 |
| 2049 | 49.76 |
| 2050 | 50.09 |
| 2051 | 50.42 |
| 2052 | 50.75 |
| 2053 | 51.07 |
| 2054 | 51.4 |
| 2055 | 51.74 |
| 2056 | 52.07 |
| 2057 | 52.41 |
| 2058 | 52.76 |
| 2059 | 53.11 |
| 2060 | 53.46 |
| 2061 | 53.83 |
| 2062 | 54.19 |
| 2063 | 54.57 |
| 2064 | 54.95 |
| 2065 | 55.33 |
| 2066 | 55.73 |
| 2067 | 56.12 |
| 2068 | 56.52 |
The chart is not accessible to screen readers. Please switch to the table view to access the data.
August 2022
Canada
July 1st, 2022
Shown here is the medium-growth scenario which contains the following assumptions at the Canada level: the total fertility rate reaches 1.59 children per woman in 2042/2043 and remains constant thereafter; life expectancy at birth reaches 83.7 years for males and 87.4 years for females in 2042/2043; interprovincial migration is based on linear interpolation of recently observed migration rates (average of rates observed between 2018/2019 and 2020/2021) to rates observed over a long period of time (average periods 1991/1992 to 2016/2017) reached in 2030/2031, and rates that remain constant thereafter; the immigration rate reaches 0.83% in 2042/2043 and remains constant thereafter; the annual number of non-permanent residents reaches 1,795,800 in 2043 and remains constant thereafter; the net emigration rate reaches 0.15% in 2042/2043 and remains constant thereafter. Adapted from Statistics Canada, statcan.gc.ca, July 1st, 2022. This does not constitute an endorsement by Statistics Canada of this product.