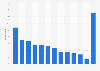
| Characteristic | Share of respondents |
|---|---|
| Traffic and weather | 16% |
| Politics and government | 13% |
| Local stories | 12% |
| Sports | 8% |
| International news | 7% |
| All news (non-specific) | 7% |
| Business, financial and economic | 4% |
| Immigration issues | 4% |
| Public safety and crime | 4% |
| Health and medicine | 3% |
| Current events | 3% |
| Science and technology | 2% |
| Environment | 2% |
| Civil rights/civil liberties | 2% |
| Marijuana/drug issues | 2% |
| National news | 1% |
| Art and culture | 1% |
| Entertainment and celebrities | 1% |
| National security/military/terrorism | 1% |
| Positive news/human interest | 1% |
| Social issues (abortion/gay marriage, etc.) | 1% |
| News about Hispanic community | 1% |
| Schools and education | 1% |
| Health care issues | 1% |
The chart is not accessible to screen readers. Please switch to the table view to access the data.
Loading statistic...
Download
Source
Sources
Release date
September 2014
More information
Region
United States
Survey time period
January 9 to February 16, 2014
Number of respondents
340 respondents
Method of interview
Telephone interview
Supplementary notes
Multiple answers were possible.
This question was phrased by the source as follows: "Next, thinking about the types of news that you do pay attention to, what is a
topic that you are really passionate about?"
Citation formats