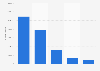
| Characteristic | Used the app |
|---|---|
| Google Maps / GPS | 40% |
| City guide | 38% |
| Local weather | 37% |
| Restaurant finder | 25% |
| Public transport | 22% |
| Currency app | 21% |
| Airline app | 18% |
| Translation / language app | 17% |
| World clock | 14% |
The chart is not accessible to screen readers. Please switch to the table view to access the data.
Loading statistic...
Download
Source
Source
Release date
November 2012
More information
Region
Worldwide
Survey time period
October 2012
Number of respondents
6,400 respondents
Special properties
All respondents have traveled for leisure purposes in the last 12 months
Method of interview
Online interview
Supplementary notes
* The source does not provide detailed information regarding the questions. The chosen wording here might therefore differ slightly from the survey.
Citation formats