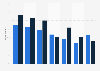
| Characteristic | Share of respondents |
|---|---|
| Using the internet for social or personal interests | 51% |
| Watching television (any device) | 51% |
| Reading newspapers (either printed or online) | 46% |
| Listening to music (using any device) | 37% |
| Reading books (either physical books or via an e-book reader/online) | 26% |
| Reading magazines (either printed or online) | 26% |
| Going to the movies | 24% |
| Playing videogames (handhelds, PC, console, mobile/cellular/smartphone, online) | 14% |
| Listening to the radio (any format/device) | 12% |
The chart is not accessible to screen readers. Please switch to the table view to access the data.
Loading statistic...
Download
Source
Source
Release date
November 2012
More information
Region
India
Survey time period
late 2011 - early 2012
Number of respondents
n = 2,006
Age group
14-75 years
Method of interview
Online survey
Supplementary notes
During the survey, this question was posed as follows: "For the following types of media please rank your top 3 with 1 being the most preferred."
Citation formats