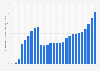
| Characteristic | Prescriptions dispensed in millions |
|---|---|
| - | - |
| - | - |
| - | - |
| - | - |
| - | - |
| - | - |
| - | - |
| - | - |
| - | - |
| - | - |
| - | - |
| - | - |
| - | - |
| - | - |
| - | - |
| - | - |
The chart is not accessible to screen readers. Please switch to the table view to access the data.
September 2025
United States
2009 to 2024
Includes prescriptions and insulins dispensed through chain and independent pharmacies, food store pharmacies, mail service pharmacies, and long-term
care facilities. Excludes OTC. Excludes COVID-19 vaccines and therapeutics. IQVIA routinely updates its national audits, which may result in changes to previously reported market size and growth rates. Prescriptions are unadjusted for length of prescriptions until 2015.
The statistic was assembled from several IQVIA (IMS Health/QuintilesIMS) reports.
** Change in data collection from 2016 on. From that year on, prescription counts are adjusted for prescription length and re-aggregated.