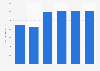
| Characteristic | Value in billion U.S. dollars |
|---|---|
| - | - |
| - | - |
| - | - |
| - | - |
| - | - |
| - | - |
The chart is not accessible to screen readers. Please switch to the table view to access the data.
Download
Source
Source
Release date
April 2015
More information
Region
United States
Survey time period
2009 to 2014
Supplementary notes
* Top therapeutic classes by non-discounted spending. Therapy areas are based on proprietary IMS Health definitions. Report reflects prescription-bound products including insulins and excluding other products such as OTC. IMS Health routinely updates its market audits, which may result in changes to previously reported market size and growth rates.
Citation formats