| Characteristic | Share of respondents |
|---|---|
| - | - |
| - | - |
| - | - |
The chart is not accessible to screen readers. Please switch to the table view to access the data.
Download
Source
Source
Release date
July 2026
More information
Region
United States
Survey time period
May 26 to June 1, 2026
Number of respondents
9,750 respondents
Age group
18 years and older
Special properties
among U.S. adults
Method of interview
Telephone interviews and online survey
Supplementary notes
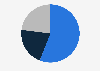
Graph shows the percentage of U.S. adults who would support social media companies for the mentioned requirements.
Note: The total number of respondents is 9,750, but those who said they oppose, are not sure, or did not answer are not shown.
Citation formats