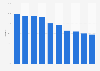
| Characteristic | Every day | A few times a week | Once a week | A few times a month | Once a month | Less than once a month | Never |
|---|---|---|---|---|---|---|---|
| Social media (e.g., Facebook, Twitter, etc.) | 50% | 18% | 5% | 7% | 4% | 5% | 11% |
| Videos/vlogs (e.g., YouTube, Vimeo etc.) | 25% | 17% | 7% | 10% | 4% | 10% | 27% |
| Entertainment/news articles (e.g., New York Times articles, Buzzfeed articles, etc.) | 15% | 13% | 7% | 9% | 3% | 9% | 44% |
| Chat boards/forums/imageboards (e.g., Reddit) | 10% | 12% | 6% | 7% | 4% | 12% | 49% |
| Blogs (e.g., Lifehacker, TMZ, Jezebel, etc.) | 10% | 12% | 5% | 6% | 3% | 11% | 54% |
| Review sites (e.g., Yelp, TripAdvisor, etc.) | 8% | 14% | 8% | 12% | 7% | 17% | 34% |
The chart is not accessible to screen readers. Please switch to the table view to access the data.
Loading statistic...
Download
Source
Source
Release date
August 2017
More information
Region
United States
Survey time period
August 10 to 14, 2017
Number of respondents
1,020 respondents
Age group
18 to 69 years
Method of interview
Online survey
Citation formats