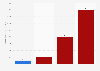
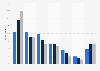
| Territory | Tether sent from the territory (in billion U.S. dollars) | Share in total Tether inflow worldwide (%) | Tether received by the territory (in billion U.S. dollars) | Share in total Tether outflow worldwide (%) |
|---|---|---|---|---|
| - | - | - | - | - |
| - | - | - | - | - |
| - | - | - | - | - |
| - | - | - | - | - |
| - | - | - | - | - |
May 2025
Worldwide
May 2025
All figures are estimates, and have been calculated by the source. See the "Details" tab for more information.
Cryptocurrency transactions by country are not publicly known. During a cryptocurrency transaction, the blockchain ledger shows the (coded) address of a receiver and a sender. However, a blockchain address does not show specific information like who is the owner behind the address or where the transaction is coming from/going to. This is deliberate, as the likes of Bitcoin were originally designed to go against banks and global financial systems. All figures on cryptocurrency transactions, from any source, are therefore estimates - and are likely to remain that way for years to come. The source of the figures shown here acknowledges this as well.
The source combines three elements to get to the current estimates:
- On-chain exchange flows, for instance from one provider to another. These figures come from ;
- Aggregate crypto app downloads and usage figures, per country. The source listed as their provider;
- Entity flow data from , a source that assigns weights to particular countries based on web traffic.
The source did not clarify what apps it focused on, and whether these included domestic-only apps or whether it only looked at apps that were globally available. For instance, Binance TR is used significantly more in Turkey than the global version of Binance. Additionally, not all apps, such as decentralized exchanges, are available for tracking.
The source mentioned that Chainalysis used a wider definition of crypto flows than Iknaio. Its figures, for example, could include miners.