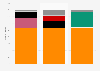
| Characteristic | Share of respondents |
|---|---|
| Democratic Alliance (AD) | 58% |
| Socialist Party (PS) | 21% |
| Does not know or does not answer | 14% |
| CHEGA | 6% |
| Another political party | 1% |
The chart is not accessible to screen readers. Please switch to the table view to access the data.
Loading statistic...
Download
Source
Sources
Release date
April 2025
More information
Region
Portugal
Survey time period
April 21 to 24, 2025
Number of respondents
1,215 respondents
Age group
18 years and older
Special properties
Individuals with active electoral capacity residing in Portugal
Method of interview
Computer-assisted telephone interviews (CATI)
Supplementary notes
The question was phrased by the source as follows: "Which do you think will be the political party with most votes in the upcoming parliamentary elections?".
The maximum sampling error is 2.8 percent for a 95 percent confidence interval.
Citation formats