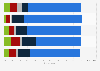
| Characteristic | I am not using it | Less than a few times per month | A few times per week | About once per day | Two times per day or more |
|---|---|---|---|---|---|
| - | - | - | - | - | - |
| - | - | - | - | - | - |
| - | - | - | - | - | - |
| - | - | - | - | - | - |
| - | - | - | - | - | - |
| - | - | - | - | - | - |
| - | - | - | - | - | - |
| - | - | - | - | - | - |
| - | - | - | - | - | - |
| - | - | - | - | - | - |
| - | - | - | - | - | - |
| - | - | - | - | - | - |
The chart is not accessible to screen readers. Please switch to the table view to access the data.
November 2024
Japan
February 2024
3,936 respondents
15-59 years
respondents were sampled to reflect the Japanese population on the basis of gender, age (in five-year intervals), and prefecture; based on the survey results, a reallocation was carried out in proportion to the ratio of social media users; multiple answers possible; answers refer to the general usage frequency (and not the hobby-specific usage frequency)
Online survey
Sample size by hobby:
Music / concerts / live performances: n=1,459
Games: n=1,305
Internet: n=1,593
Taking photos or videos: n=584
Reading / manga: n=1,543
Viewing sports: n=945
Watching television / movies / videos: n=2,073
Learning / self-improvement: n=447
Sports, training: n=693
Creating DIY / handicrafts / pottery / paintings: n=432
Cooking / confectionery: n=831
Traveling / gourmet: 1,655