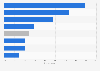
| Characteristic | Prefer non-streaming video content | Prefer streaming video content | Do not consume video content |
|---|---|---|---|
| - | - | - | - |
| - | - | - | - |
| - | - | - | - |
The chart is not accessible to screen readers. Please switch to the table view to access the data.
Download
Source
Source
Release date
May 2024
More information
Region
Taiwan
Survey time period
Q4 2023
Number of respondents
1,068 respondents
Age group
18-65 years
Method of interview
Online survey
Supplementary notes
Original survey question:
What is your preferred method of watching 鈥渧ideo content鈥�? (Single-choice question)
The number of respondents from each age group are as follows:
Ages 18 to 25: 139 respondents; ages 26 to 35: 211 respondents; ages 36 to 45: 249 respondents; ages 46 to 55: 238 respondents; ages 56 to 65: 231 respondents;
Citation formats