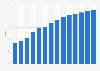
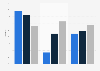
| Characteristic | Penetration rate |
|---|---|
| - | - |
| - | - |
| - | - |
| - | - |
The chart is not accessible to screen readers. Please switch to the table view to access the data.
Download
Source
Source
Release date
August 2024
More information
Region
Asia, Taiwan
Survey time period
2020 to 2023
Number of respondents
1,938 in 2020; 1,960 in 2021; 1,922 in 2022; 1,911 in 2023
Age group
15-69 years
Special properties
annual survey conducted between November and following January every year
Method of interview
Online survey
Supplementary notes
Among respondents who had consumed movies and TV shows in the year prior to the survey period.
Citation formats