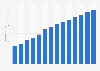
| Characteristic | Spending in million U.S. dollars |
|---|---|
| - | - |
| - | - |
| - | - |
The chart is not accessible to screen readers. Please switch to the table view to access the data.
Download
Source
Source
In cooperation with
Nielsen
Release date
December 2022
More information
Region
United Kingdom
Survey time period
2019 to 2021
Special properties
gross figures; excluding volume discounts; excluding paid social and search
Supplementary notes
Ad spend is calculated by multiplying the impression data for each ad event captured with the relevant CPM data for that event.
Citation formats