| Characteristic | Share of respondents |
|---|---|
| - | - |
| - | - |
| - | - |
| - | - |
| - | - |
| - | - |
| - | - |
The chart is not accessible to screen readers. Please switch to the table view to access the data.
Download
Source
Source
In cooperation with
Appinio & Spryker
Release date
January 2022
More information
Region
United States
Survey time period
September 2021
Number of respondents
2,500 respondents
Age group
14-65 years
Special properties
21% of respondents live in urban cores; 35% in large suburban region; 17% in smaller metropolitan areas; 27% in rural areas
Method of interview
Online survey
Supplementary notes
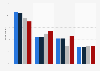
The question was originally stated as "How frequently do you purchase ready-made food from a grocery store?"
Percentages do not add up to 100 due to rounding.
Citation formats