| Characteristic | Monthly number of searches* |
|---|---|
| - | - |
| - | - |
| - | - |
| - | - |
| - | - |
| - | - |
| - | - |
| - | - |
| - | - |
| - | - |
| - | - |
| - | - |
| - | - |
| - | - |
| - | - |
| - | - |
| - | - |
| - | - |
| - | - |
| - | - |
| - | - |
| - | - |
| - | - |
| - | - |
| - | - |
| - | - |
| - | - |
| - | - |
| - | - |
| - | - |
| - | - |
| - | - |
The chart is not accessible to screen readers. Please switch to the table view to access the data.
Download
Source
Source
In cooperation with
Holidu.nl
Release date
November 2021
More information
Region
Netherlands
Survey time period
November 2021
Supplementary notes
* The source adds the following methodology information (in Dutch):
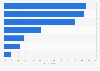
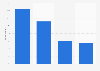
"All Dutch cities with a population of over 75,000 were considered for this study. The list was supplemented by the capitals of the provinces with fewer than 75,000 inhabitants, so that at least the capital of each Dutch province would be represented in the list. The popularity of these cities for shopping was tested based on the search volume of Dutch audiences on Google. We examined the search volume for both the keywords 'black friday' + destination, and 'shopping' + destination. Then the search volume for these two search terms added together to the total search volume per month."
Citation formats