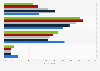
| Characteristic | Have not seen advertisements | See rarely | See often | See very often |
|---|---|---|---|---|
| - | - | - | - | - |
| - | - | - | - | - |
| - | - | - | - | - |
The chart is not accessible to screen readers. Please switch to the table view to access the data.
Download
Source
Source
Release date
June 2021
More information
Region
Belarus, Russia, Ukraine
Survey time period
2021
Number of respondents
70,000 respondents*
Special properties
Telegram users
Method of interview
Online survey
Supplementary notes
* Total survey sample. Statistic represents replies of users from Russia (60 percent), Belarus (17 percent) and Ukraine (13 percent).
Citation formats