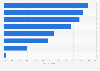
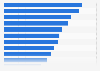
| Characteristic | 2021 | 2022 | 2023 | 2024 |
|---|---|---|---|---|
| Other (selling technology, content syndication, government support) | 20% | 5% | 5% | - |
| Micropayment (incl. digital wallets) | 6% | 5% | 6% | 6% |
| Related businesses (e.g. property, jobs, betting) | 14% | 16% | 15% | 16% |
| Donations/suport from philanthropic funds/foundations | 10% | 15% | 18% | 15% |
| Donations or crowdfunding (one-off or recurring donations from consumers) | 14% | 17% | 20% | 15% |
| E-commerce | 29% | 30% | 26% | 29% |
| Funding from platforms (content licensing or innovation projects) | 23% | 29% | 33% | 20% |
| Events | 40% | 40% | 38% | 49% |
| Native advertising (sponsored content) | 61% | 59% | 58% | 61% |
| Display advertising/sponsorship | 66% | 73% | 75% | 72% |
| Subscription (ongoing regular payments for content, premium features, or both) | 76% | 79% | 80% | 80% |
The chart is not accessible to screen readers. Please switch to the table view to access the data.
Loading statistic...
Download
Source
Source
Release date
January 2024
More information
Region
Worldwide
Survey time period
2020 to 2023*
Number of respondents
2022: 273
Age group
18 years and older
Special properties
among those holding senior positions (editorial, commercial, or product) in traditional or digital-born publishing companies
Method of interview
Online survey
Supplementary notes
*Surveys held in December of each year, data refers to year ahead.
Participants came from organizations with a print background, digital-born media, B2B companies, or news agencies, or represented commercial or public service broadcasters.
Data for previous years come from earlier reports.
Missing data was not provided by the source.
Citation formats