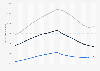
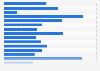
| Characteristic | Bulgaria | Czechoslovakia | East Germany | Hungary | Poland | Romania |
|---|---|---|---|---|---|---|
| 1970 | 7.1% | 5.7% | 5.6% | 4.9% | 5.2% | 6.8% |
| 1971 | 6.9% | 5.5% | 4.4% | 5.9% | 8.1% | 13.5% |
| 1972 | 7.7% | 5.7% | 5.7% | 6.2% | 10.6% | 9.8% |
| 1973 | 8.1% | 5.2% | 5.6% | 7% | 10.8% | 10.7% |
| 1974 | 7.6% | 5.9% | 6.5% | 5.9% | 10.5% | 12.3% |
| 1975 | 8.8% | 6.2% | 4.9% | 6.1% | 9% | 9.8% |
| 1976 | 6.5% | 4.1% | 3.5% | 3% | 6.8% | 11.3% |
| 1977 | 6.3% | 4.2% | 5.1% | 7.1% | 5% | 8.7% |
| 1978 | 5.6% | 4.1% | 3.7% | 4% | 3% | 7.2% |
| 1979 | 6.6% | 3.1% | 4% | 1.2% | -2.3% | 6.5% |
| 1980 | 5.7% | 2.9% | 4.4% | -0.9% | -6% | 4.2% |
| 1981 | 5% | -0.1% | 4.8% | 2.5% | -12% | -0.4% |
| 1982 | 4.2% | 0.2% | 2.6% | 2.6% | -5.5% | 4% |
| 1983 | 3% | 2.3% | 4.6% | 0.3% | 6% | 6% |
| 1984 | 4.6% | 3.5% | 5.5% | 2.5% | 5.6% | 6.5% |
| 1985 | 1.8% | 3% | 5.2% | -1.4% | 3.4% | -1.1% |
| 1986 | 5.3% | 2.6% | 4.3% | 0.9% | 4.9% | 3% |
| 1987 | 5% | 2.1% | 3.3% | 4.1% | 1.9% | 0.7% |
| 1988 | 2.4% | 2.4% | 2.8% | -0.5% | 4.9% | -2% |
| 1989 | -0.4% | 1.3% | 2.1% | -1.1% | -0.2% | -7.9% |
| 1990 | -13.6% | -3.1% | -19.5% | -5.5% | -13% | -10.5% |
The chart is not accessible to screen readers. Please switch to the table view to access the data.
Zoomable Statistic: Select the range in the chart you want to zoom in on.
Loading statistic...
Download
Source
More information
Region
Bulgaria, Czechia, Hungary, Poland, Romania, Slovakia, German Democratic Republic, Central and Eastern Europe
Survey time period
1970 to 1990
Supplementary notes
*Net Material Product (NMP) was the main key economic indictor used in planned economies throughout the twentieth century (Soviet/COMECON states). NMP is calculated in a similar way to GDP, however NMP focuses on tangible output and excludes many of the factors included in GDP, such as the output of service sectors, and spending on healthcare, state administration, and defense.
Citation formats