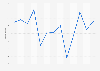
| Characteristic | Plan to increase spending in the next six months | Plan to decrease spending in the next six months |
|---|---|---|
| - | - | - |
| - | - | - |
| - | - | - |
The chart is not accessible to screen readers. Please switch to the table view to access the data.
Download
Source
Source
Release date
April 2020
More information
Region
India
Survey time period
March 23 to 26, 2020
Number of respondents
2,106 respondents
Supplementary notes
Representative of the top 35% of the metro tier 2 population of India
Question text: How do you expect your spend to change in the next 6 months across the following areas?
Citation formats