

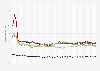


| Characteristic | All retailing | Predominantly food stores | Textiles clothing and footwear stores | Household goods stores | Other stores | Department stores | Non-store retailing |
|---|---|---|---|---|---|---|---|
| Mar '25 | 5.4% | 4.1% | 6.3% | -5.2% | 17.5% | 16.5% | 2.9% |
| Feb '25 | 2.8% | 5.7% | 2% | -1.5% | 11.6% | 11.2% | -0.2% |
| Jan '25 | 0.3% | 5% | -1.6% | -7.9% | 12.6% | 9% | -3.1% |
| Dec '24 | 0.6% | 1.9% | 7.3% | -0.1% | 22.5% | 12.2% | -7.2% |
| Nov '24 | -2.1% | -2.9% | -3.5% | -13.7% | 8.2% | 8.2% | -3.3% |
| Oct '24 | 4.9% | 2.7% | 4.1% | -7.1% | 37.5% | 7.3% | 1.1% |
| Sep '24 | 6.2% | 1.2% | 9.5% | -9.2% | 41.5% | 14.6% | 1.6% |
| Aug '24 | 2.8% | -0.5% | 0.8% | -14.5% | 25.9% | 14% | 1.3% |
| Jul '24 | 4.1% | 0.7% | -6.4% | -16.9% | 25.6% | 17.4% | 5.4% |
| Jun '24 | 3.4% | 0.5% | -6.8% | -15.5% | 31.8% | -1.3% | 5.5% |
| May'24 | 6% | 2% | -1.5% | -13.1% | 25.6% | 9.5% | 8.3% |
| Apr '24 | -0.2% | -1.9% | -3.6% | -13.4% | 18.9% | 5.7% | -1.1% |
| Mar '24 | 2.8% | 6% | -1.4% | -8.9% | 15.2% | -1.1% | 2.9% |
| Feb '24 | 3.6% | 4.1% | -0.9% | -4.4% | 13.6% | 2.6% | 4.1% |
| Jan '24 | 4.6% | 5.1% | -1.3% | 3.6% | 13.7% | 0.7% | 5.1% |
| Dec '23 | 10% | 4.1% | 9.7% | -0.5% | 15.4% | -2.6% | 14.8% |
| Nov '23 | 10.4% | 7.8% | 14% | 16.4% | 17.7% | 1.1% | 9.3% |
| Oct '23 | 6.6% | 7% | 14.8% | 20.7% | -4.8% | 0% | 5.9% |
| Sep '23 | 7.4% | 14.1% | 10.8% | 23.2% | -2.1% | -3.4% | 6% |
| Aug' 23 | 9.9% | 13.2% | 17.9% | 21.3% | -1.9% | -2.5% | 9.5% |
| Jul '23 | 9.4% | 8.5% | 16% | 12.4% | 8.7% | -5.4% | 9.8% |
| Jun '23 | 7.6% | 9.3% | 18% | 15.5% | 1.4% | 4.2% | 5.2% |
| May '23 | 6.8% | 12% | 21.8% | 10% | -0.2% | 3.8% | 3.1% |
| Apr '23 | 2.9% | 9.2% | 11.5% | 7.9% | 0.1% | 0.7% | -0.8% |
| Mar '23 | 4.3% | 2.8% | 11.2% | 12.1% | -5% | -0.6% | 4.7% |
| Feb '23 | -2.1% | 3.8% | 6.3% | 10.4% | -11.7% | 0.4% | -5.6% |
| Jan '23 | -5.9% | 0.7% | 12.1% | 5.4% | -15.8% | 1.2% | -11.8% |
| Dec '22 | -7.8% | 2.2% | -2% | 10.4% | -10.9% | 3.3% | -15.2% |
| Nov '22 | -5.6% | 2.4% | -1.8% | -0.9% | -2.9% | 1.9% | -10.8% |
| Oct '22 | -7% | -3.5% | -6.1% | -11.5% | 0.1% | -2.5% | -9.6% |
| Sep '22 | -8.1% | -10.5% | -0.4% | -9.5% | 0.1% | -1.6% | -11.3% |
| Aug '22 | -8.7% | -11.5% | -4.7% | -9.1% | 0.1% | -2.9% | -11.1% |
| Jul '22 | -6.2% | -11.1% | 0.1% | -4.8% | 0.3% | -10.2% | -6.9% |
| Jun '22 | -8% | -12.4% | -2.7% | -11.9% | -0.4% | -2.6% | -9.3% |
| May '22 | -7.9% | -12.2% | 1.6% | -16.5% | -5.9% | -14.3% | -6.5% |
| Apr '22 | -10% | -12.7% | -5.5% | -22.1% | -20.2% | -12.9% | -5.1% |
| Mar '22 | -19.6% | -19.3% | -15.1% | -34.4% | -24.7% | -32.4% | -14% |
| Feb '22 | -16% | -22.4% | -12.5% | -39.1% | -19.1% | -32.4% | -6.1% |
| Jan '22 | -9.5% | -22.7% | 0.6% | -27.8% | -17.6% | -20.9% | 0.2% |
The chart is not accessible to screen readers. Please switch to the table view to access the data.
Zoomable Statistic: Select the range in the chart you want to zoom in on.
Loading statistic...
Download
Source
Source
Release date
April 2025
More information
Region
United Kingdom
Survey time period
January 2022 to March 2025
Supplementary notes
'All retailing' sector excludes automotive fuel.
Figures are percentage change compared to the same month the previous year.
Values have been seasonally adjusted
This statistic is using original data from the Office for National Statistics and includes copyright material from 漏 Crown, licensed under the .
Citation formats



