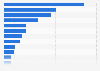
| Characteristic | March | April | May | June | July |
|---|---|---|---|---|---|
| Abruzzo | -84% | -90% | -21% | -1% | 7% |
| Aosta Valley | -88% | -83% | -41% | -3% | 20% |
| Apulia | -85% | -87% | -21% | -7% | -2% |
| Basilicata | -84% | -84% | -19% | -2% | -2% |
| Calabria | -92% | -80% | -24% | 1% | 13% |
| Campania | -78% | -91% | -19% | -5% | -8% |
| Emilia-Romagna | -94% | -57% | -23% | -12% | -12% |
| Friuli-Venezia Giulia | -94% | -91% | -17% | -12% | -11% |
| Lazio | -76% | -57% | -23% | -13% | -17% |
| Liguria | -80% | -67% | -27% | 0% | 1% |
| Lombardy | -81% | -74% | -34% | -19% | -21% |
| Marche | -88% | -69% | -24% | -14% | -6% |
| Molise | -82% | -91% | -26% | 0% | 7% |
| Piedmont | -82% | -65% | -33% | -16% | -16% |
| Sardinia | -92% | -92% | -24% | -3% | 9% |
| Sicily | -93% | -92% | -19% | -5% | -5% |
| Trentino-South Tyrol | -94% | -88% | -24% | -6% | 11% |
| Tuscany | -84% | -61% | -29% | -12% | -11% |
| Umbria | -89% | -91% | -26% | -10% | -11% |
| Veneto | -95% | -92% | -20% | -12% | -12% |
The chart is not accessible to screen readers. Please switch to the table view to access the data.
Loading statistic...
Download
Source
Source
Release date
July 2020
More information
Region
Italy
Survey time period
January to July 2020
Supplementary notes
Percentage change compared to the baseline i. e. the median value over one week calculated during the 5-week period Jan 3鈥揊eb 6, 2020.
It includes grocery
markets, food warehouses, farmers markets, specialty food shops, drug stores, and pharmacies.
Citation formats