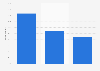
| Characteristic | Percentage of respondants |
|---|---|
| Usually much higher than what consumers should be paying | 69% |
| Tend to be somewhat higher | 20% |
| About right | 9% |
| Tend to be somewhat lower | 1% |
| Usually much lower than what consumers should be paying | 1% |
The chart is not accessible to screen readers. Please switch to the table view to access the data.
Loading statistic...
Download
Source
Sources
Release date
November 2019
More information
Region
United States
Survey time period
September 16-30, 2019
Number of respondents
1,099 respondents
Age group
18 years and older
Method of interview
Telephone interview
Supplementary notes
Original Question: "Based on everything you have read and experienced, please indicate which of the following statements most closely align with your opinion regarding the cost of prescription drugs in the U.S.?"
Citation formats