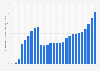
| Characteristic | New brands | Protected brands price | Protected brands volume | Generics price | Generics volume | Patent expiries |
|---|---|---|---|---|---|---|
| 2021* | 39 | 6.1 | 14.8 | -0.2 | - | -15.8 |
| 2020* | 13.9 | -9.5 | 18.7 | -0.8 | - | -18.6 |
| 2019 | 13.8 | 5 | 12.4 | -2.8 | 1.6 | -21.1 |
| 2018 | 11 | 0.8 | 13.2 | -0.7 | -1.4 | -8.2 |
| 2017 | 12 | 4 | 6.8 | -5 | -0.5 | -17.3 |
| 2016 | 13.2 | 7 | 4.5 | 1.3 | 1.6 | -13.7 |
| 2015 | 17.3 | 3.7 | 9.9 | 2.6 | 4 | -9.4 |
| 2014 | 20.9 | 6.7 | 2.1 | 5.1 | 1.8 | -9.8 |
The chart is not accessible to screen readers. Please switch to the table view to access the data.
Loading statistic...
Download
Source
Source
Release date
April 2022
More information
Region
United States
Survey time period
2014 to 2021
Supplementary notes
Spending is based on net manufacturer prices. Generics include both unbranded and branded generics. COVID-19 vaccines and therapeutics are inclkuded. Segments are mutually exclusive. Includes all medicines in both pharmacy and institutional settings.
Protected brand growth is split by volume and price growth. New Brands segment includes products launched in the last two years. Patent expiry category represents the impact of products that lost exclusivity.
* No data explicitly for generics price/volume in the source.
Citation formats