| Decade | Textiles | Iron | Military stores | Others | Total |
|---|---|---|---|---|---|
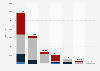
| 1799-1808 | 7,491,722 | 313,461 | 658,919 | 2,286,675 | 10,750,777 |
| 1789-1798 | 5,696,644 | 440,600 | 391,245 | 1,658,641 | 8,187,130 |
| 1779-1788 | 3,729,694 | 294,772 | 274,739 | 971,540 | 5,270,745 |
| 1769-1778 | 3,740,616 | 378,893 | 325,959 | 1,437,594 | 5,883,062 |
| 1759-1768 | 2,666,814 | 359,222 | 238,935 | 971,434 | 4,236,405 |
| 1749-1758 | 1,220,914 | 230,437 | 128,346 | 422,751 | 2,002,448 |
| 1739-1748 | 993,123 | 166,444 | 64,335 | 282,514 | 1,506,416 |
| 1729-1738 | 1,360,379 | 198,462 | 76,403 | 389,727 | 2,024,971 |
| 1719-1728 | 1,030,534 | 127,136 | 52,311 | 405,794 | 1,615,775 |
| 1709-1718 | 490,065 | 71,583 | 23,712 | 138,092 | 723,452 |
| 1699-1708 | 564,929 | 84,988 | 21,454 | 208,858 | 880,229 |
The chart is not accessible to screen readers. Please switch to the table view to access the data.
Loading statistic...
Download
Source
Source
Release date
June 2018
More information
Region
Africa, United Kingdom
Survey time period
1699 to 1808
Supplementary notes
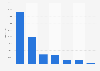
The total value of all exports was 43,081,410 British pounds sterling (GBP). The total values of each category, and their share of overall export value (in percentage) are as follows:
Textiles: 28,985,434 GBP (67.28 percent)
Iron: 2,665,998 GBP (6.19 percent)
Military stores: 2,256,358 GBP (5.24 percent)
Others: 9,173,620 GBP (21.29 percent)
Citation formats