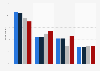
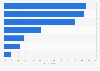
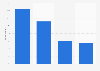
| Characteristic | Number of purchases per month |
|---|---|
| Shopping for food in stores | 17.8 |
| Online food shopping | 2.2 |
| Buying ready-to-eat food in stores | 4.9 |
| Buying ready-to-eat food online | 2.3 |
| Going to fast food stores (cafes, canteens) | 4 |
| Going to restaurants/bars | 2 |
| Buying alcoholic beverages in stores | 4 |
| Buying baby and children's products in stores | 1.8 |
| Buying baby and children's products online | 1.1 |
| Buying home care products in stores | 3.1 |
| Buying home care products online | 1.4 |
| Buying cosmetics in stores | 1.9 |
| Buying cosmetics online | 1.2 |
| Buying clothing in stores | 1.8 |
| Buying clothing online | 1.5 |
| Buying consumer electronics and home appliances in stores | 1.1 |
| Buying consumer electronics and home appliances online | 1 |
| Buying footwear in stores | 1.3 |
| Buying footwear online | 0.9 |
| Buying perfumery in stores | 1.3 |
| Buying perfumery online | 0.9 |
| Buying goods for construction, repair, crafting in stores | 1.3 |
| Buying goods for construction, repair, crafting online | 0.8 |
| Buying household goods in stores | 1.1 |
| Buying household goods online | 0.8 |
The chart is not accessible to screen readers. Please switch to the table view to access the data.
Loading statistic...
Download
Source
More information
Region
Russia
Survey time period
April 2021
Number of respondents
1,614 respondents
Age group
16 years and older
Special properties
Internet users
Method of interview
Online survey
Supplementary notes
The averaged subjective perception of purchasing frequency by the respondents.
The source specified that the population sample represented eight federal districts of the country, over 200 localities.
Citation formats