

| Characteristic | Share of respondents |
|---|---|
| - | - |
| - | - |
| - | - |
| - | - |
| - | - |
| - | - |
The chart is not accessible to screen readers. Please switch to the table view to access the data.
Download
Source
Source
Release date
June 2018
More information
Region
Brazil
Survey time period
2013 to 2017
Number of respondents
>1,000*
Special properties
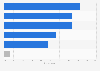
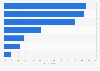
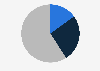
the graph represents the answers for daily, weekly and monthly purchases
Supplementary notes
Number of respondents varied through the years, but always slightly over 1,000.
The source does not provide information about the survey type or the age of the respondents.
Citation formats