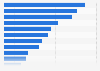
| Characteristic | Share of respondents |
|---|---|
| - | - |
| - | - |
| - | - |
| - | - |
| - | - |
| - | - |
| - | - |
| - | - |
The chart is not accessible to screen readers. Please switch to the table view to access the data.
Download
Source
Source
Release date
December 2017
More information
Region
Japan
Survey time period
June to July 2017
Number of respondents
1,564 respondents
Age group
4-11 years
Method of interview
Questionnaire
Supplementary notes
*Media usage includes watching TV or DVD, using computer, video games (including TV, computer and cellular device games, etc.) or using smartphone per day outside of school class (including kindergarten and pre-school).
Citation formats