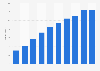


| Characteristic | 2016 | 2017 | 2018 | 2019 | 2020 | 2021 | 2022 |
|---|---|---|---|---|---|---|---|
| - | - | - | - | - | - | - | - |
| - | - | - | - | - | - | - | - |
| - | - | - | - | - | - | - | - |
| - | - | - | - | - | - | - | - |
| - | - | - | - | - | - | - | - |
| - | - | - | - | - | - | - | - |
The chart is not accessible to screen readers. Please switch to the table view to access the data.
Download
Source
Source
Release date
January 2023
More information
Region
Europe
Survey time period
2016 to 2022
Special properties
excluding travel, restaurants, tickets, transport.
Supplementary notes
Figures prior to 2019 were published by the same source in previous versions of their research. The source adds the following information: "We use the strict definition of retail and do not study travel, restaurants, tickets, transport etc. because it ain't the retail industry."The source did not specify a date of release for this research. Therefore, date of access is used here.
Citation formats



