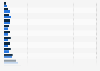
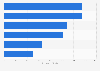
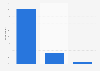
| Characteristic | Minimum | Maximum |
|---|---|---|
| - | - | - |
| - | - | - |
| - | - | - |
| - | - | - |
| - | - | - |
The chart is not accessible to screen readers. Please switch to the table view to access the data.
Download
Source
Sources
Release date
November 2017
More information
Region
Canada, Asia, United Kingdom, United States
Survey time period
as of 2017
Special properties
adjusted costs
Supplementary notes
* The data is based on sixty-six studies (83%) were conducted in the USA, four in Europe, four in Asia, three in Canada, one in the UK and one across multiple countries throughout Europe and the UK. Publication years
ranged from 1997 to 2017.
All costs were converted to US$ (2015 values) using the Cochrane
Economics Methods Group鈥擡vidence for Policy and
Practice Information and Coordinating鈥擟entre Cost
Converter tool, allowing meaningful comparisons
between non-adherence cost data.
Citation formats