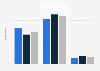
| Characteristic | Share of respondents wanting shop |
|---|---|
| - | - |
| - | - |
| - | - |
| - | - |
| - | - |
| - | - |
| - | - |
| - | - |
| - | - |
| - | - |
| - | - |
| - | - |
| - | - |
| - | - |
| - | - |
The chart is not accessible to screen readers. Please switch to the table view to access the data.
Download
Source
Source
Release date
June 2018
More information
Region
United Kingdom
Survey time period
May 20-22, 2018
Number of respondents
3273**
Age group
18 years and older
Method of interview
Computer-assisted telephone interviews (CATI)
Supplementary notes
* The question asked in the survey was: 'Thinking about your ideal high street, which of the following types of shops would you want or not want to see on it?'
** Total number of respondents. Respondents randomly saw thirteen of the shops included in the survey, meaning that the number of respondents is dependent on each shop type.
Bank: n=1603
Post Office: n=1638
Pharmacy: n=1608
Restaurants/cafes: n=1662
Clothes shop: n=1625
Newsagent: n=1632
Homeware store: n=1679
Barber/Hairdresser: n=1656
Book store: n=1691
Coffee shop: n=1666
Department store: n=1663
Supermarket: n=1660
Electronic goods store: n=1609
Pub: n=1643
Cinema: n=1631
Citation formats