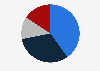
| Characteristic | Share of respondents |
|---|---|
| - | - |
| - | - |
| - | - |
| - | - |
| - | - |
| - | - |
| - | - |
The chart is not accessible to screen readers. Please switch to the table view to access the data.
Download
Source
Source
Release date
December 2017
More information
Region
Belgium
Survey time period
May, 2017 to June, 2017
Number of respondents
1,593 respondents
Age group
18-75 years
Special properties
all smartphone owners; Students (218); Young professionals (334); Parents (650); Grandparents (148)
Method of interview
Questionnaire
Supplementary notes
This question was phrased by the source as followed: ''Which, if any, is your preferred device for each of the following activities?''
Citation formats