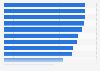
| Characteristic | Share of respondents |
|---|---|
| - | - |
| - | - |
| - | - |
| - | - |
The chart is not accessible to screen readers. Please switch to the table view to access the data.
Download
Source
Source
Release date
November 2016
More information
Region
United States
Survey time period
2016
Number of respondents
211 respondents
Special properties
Household income of less than $50k
Supplementary notes
This question was phrased by the source as follows: "What is your one primary retailer for purchasing the category?"
The source did not provide further methodology information.
Citation formats