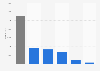
| Characteristic | Share of respondents |
|---|---|
| Produce, fruits, vegetables | 65% |
| Hot breakfast foods: meats, pancake & waffle mixes, potato, etc. | 65% |
| Cold breakfast foods: cereal, yogurt, breads, etc. | 64% |
| Entrees: proteins - chicken, duck, seafood | 60% |
| Entrees: proteins - beef, lamb, pork | 60% |
| Croissants, Danish and muffins | 56% |
| Artisan breads and rolls | 55% |
| Microgreens: salads, premium lettuce | 55% |
| Side dish: soup, beans, grains, vegetables | 54% |
| Gourmet desserts: cakes, pies, brownies | 52% |
| Prepared bar appetizers, batters and breadings | 47% |
| Frozen desserts | 44% |
| Prepared entrees for banquets and buffets | 29% |
| Other bakery/dessert items | 1% |
| Other entrees/appetizers/soups/vegetables | 1% |
The chart is not accessible to screen readers. Please switch to the table view to access the data.
Loading statistic...
Download
Source
Source
Release date
June 2017
More information
Region
United States
Survey time period
April, 2017
Number of respondents
107 respondents
Special properties
mostly hotels that offer full-service F&B鈥攊.e., they have at least one restaurant on-property.
Supplementary notes
Multiple answer were possible.
The source did not provide detailed information regarding the age of respondents or method of survey.
Citation formats