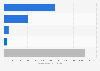
| Characteristic | Number of establishments in thousands |
|---|---|
| - | - |
| - | - |
| - | - |
| - | - |
| - | - |
| - | - |
| - | - |
| - | - |
| - | - |
| - | - |
| - | - |
| - | - |
| - | - |
| - | - |
| - | - |
| - | - |
| - | - |
| - | - |
| - | - |
| - | - |
| - | - |
| - | - |
| - | - |
The chart is not accessible to screen readers. Please switch to the table view to access the data.
Download
Source
Source
Release date
December 2024
More information
Region
South Korea
Survey time period
2005 to 2023
Supplementary notes
Snack bar/restaurant in this statistic refers to a food counter selling snack foods and light meals such as flour-based foods ('Bunsik' in Korean), fast food, ice cream and non-alcoholic beverages. Unlike 'general restaurant', it is banned to sell alcoholic beverages at snack bar/restaurants in South Korea.
Figures have been rounded.
Citation formats