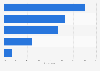
| Characteristic | Share of respondents |
|---|---|
| - | - |
| - | - |
| - | - |
| - | - |
The chart is not accessible to screen readers. Please switch to the table view to access the data.
Download
Source
Source
Release date
June 2016
More information
Region
United States
Survey time period
November to December 2015**
Number of respondents
~ 1,000
Special properties
U.S. Hispanic shoppers
Method of interview
Online survey
Supplementary notes
* Hispanics who eat more organic foods even if they are more expensive.
** Study and survey characteristics apply to 2015 survey. Previous years were conducted among equally large samples.
The original source does not provide any information about the age of the respondents.
The original source does not specify the exact formulation of the question posed.
Citation formats