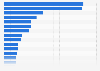
| Characteristic | Percent change in compensation |
|---|---|
| Diabetes and endocrinology | 7% |
| Anesthesiology | 6% |
| Infectious diseases | 6% |
| Nephrology | 6% |
| Obstetrics and gynacology | 6% |
| Otolaryngology | 6% |
| Pathology | 6% |
| Physical medicine and rehabilitation | 6% |
| Psychiatry | 5% |
| Radiology | 5% |
| Allergy and immunology | 4% |
| Critical care | 4% |
| Internal medicine | 4% |
| Family medicine | 3% |
| General surgery | 3% |
| Emergency medicine | 2% |
| Oncology (and Hematology) | 2% |
| Pediatrics | 2% |
| Orthopedics (and Orthopedic surgery) | 1% |
| Plastic surgery | 1% |
| Pulmonary medicine | 1% |
| Cardiology | -1% |
| Urology | -2% |
| Neurology | -3% |
| Dermatology | -5% |
The chart is not accessible to screen readers. Please switch to the table view to access the data.
Loading statistic...
Download
Source
Source
Release date
July 2025
More information
Region
United States
Survey time period
October 3, 2024, to January 15, 2025
Number of respondents
7,322 respondents
Special properties
Full-time U.S. practicing physicians
Method of interview
Online survey
Supplementary notes
Data compares the results from the 2025 and 2024 Medscape Physician Compensation Report.
Citation formats