| Characteristic | 2022/23 | 2023/24 |
|---|---|---|
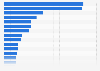
| Orthopedic Surgery | 633,000 | 686,000 |
| Gastroenterology | 506,000 | 531,000 |
| Urology | 540,000 | 496,000 |
| Radiology | 472,000 | 495,000 |
| Dermatology | 427,000 | 486,000 |
| Anesthesiology | 450,000 | 460,000 |
| Hematology/Oncology | 440,000 | 444,000 |
| Cardiology | 433,000 | 396,000 |
| Obstetrics/Gynecology | 367,000 | 389,000 |
| Neurology | 354,000 | 383,000 |
| Psychiatry | 355,000 | 285,000 |
| Hospitalist | 299,000 | 283,000 |
| Family Medicine | 225,000 | 271,000 |
| Internal Medicine | 225,000 | 271,000 |
| Pediatrics | 233,000 | 244,000 |
The chart is not accessible to screen readers. Please switch to the table view to access the data.
July 2024
United States
April 1, 2019 to March 31, 2021
2,458 respondents
The source adds the following: "Year-over-year starting salary fluctuations may sometimes result if AMN Healthcare conducted an unusually large number of searches for a given specialty in a market where physician compensation is either atypically low or high. Fluctuations also may occur if market conditions change in a given specialty. For example, the near 20% drop in average starting salaries for psychiatrists may be a result of the markets in which some of these search engagements were conducted and the decline may be a one-year aberration. The near 14% increase in starting salaries for dermatologists represents the second year starting salaries for dermatologists have increased significantly, and likely is the result of rapidly accelerating demand for this specialty."