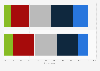
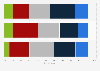
| Characteristic | Tablet | Smartphone | Laptop computer | Not watching anything |
|---|---|---|---|---|
| - | - | - | - | - |
| - | - | - | - | - |
| - | - | - | - | - |
| - | - | - | - | - |
| - | - | - | - | - |
| - | - | - | - | - |
| - | - | - | - | - |
| - | - | - | - | - |
| - | - | - | - | - |
| - | - | - | - | - |
| - | - | - | - | - |
| - | - | - | - | - |
The chart is not accessible to screen readers. Please switch to the table view to access the data.
Download
Source
Source
Release date
June 2016
More information
Region
Finland
Survey time period
2014 to 2016
Number of respondents
2,041 respondents
Age group
18-79 years
Method of interview
Online survey
Supplementary notes
The question for the survey was phrased by the source as follows: "Mit盲 seuraavista laitteista k盲yt盲t mieluiten tv-sis盲ll枚n katsomiseen miss盲kin paikassa?"
Citation formats