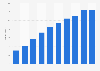


| Expenditure in euros | Less than 50 euros | 50 - 100 euros | 100 - 500 euros | 500 - 1,000 euros | 1,000 euros or more | Don't know |
|---|---|---|---|---|---|---|
| - | - | - | - | - | - | - |
| - | - | - | - | - | - | - |
| - | - | - | - | - | - | - |
| - | - | - | - | - | - | - |
| - | - | - | - | - | - | - |
The chart is not accessible to screen readers. Please switch to the table view to access the data.
Download
Source
Source
Release date
October 2019
More information
Region
Netherlands
Survey time period
2015 to 2019
Number of respondents
4,500 respondents
Age group
12 years and older
Special properties
expenditure of online purchases over the previous three months
Method of interview
Computer-assisted telephone interviews (CATI)
Supplementary notes
Original survey question: "What do you estimate was the total amount you spent on good or services you purchased or ordered online?"
The source does not provide any information regarding missing percentage points to 100 percent.
Citation formats



