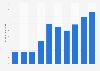
| Characteristic | Direct investments in billion U.S. dollars |
|---|---|
| 2000 | 814.03 |
| 2001 | 841.93 |
| 2002 | 810.31 |
| 2003 | 852.39 |
| 2004 | 943.07 |
| 2005 | 999.28 |
| 2006 | 1,165.56 |
| 2007 | 1,247.71 |
| 2008 | 1,289.93 |
| 2009 | 1,340.38 |
| 2010 | 1,457.84 |
| 2011 | 1,507.15 |
| 2012 | 1,609.02 |
| 2013 | 1,649.77 |
| 2014 | 1,725.71 |
| 2015 | 2,018.28 |
| 2016 | 2,134.3 |
| 2017 | 2,248.18 |
| 2018 | 2,451.33 |
| 2019 | 24,824 |
| 2020 | 2,101.48 |
| 2021 | 2,276.79 |
| 2022 | 2,367.66 |
The chart is not accessible to screen readers. Please switch to the table view to access the data.
December 2023
United States, EU
2000 to 2022
Database accessed on December 5, 2023
Data are classified by country of the foreign parent of the U.S. affiliate. The foreign parent is the first person outside the United States in a U.S. affiliate's ownership chain that has a direct investment in the affiliate. In addition to equity and debt investment from its foreign parent, a U.S. affiliate may receive loans from (or make loans to) foreign affiliates of the foreign parent (FAFPs). The affiliate may also have interest and services transactions with foreign affiliates of the foreign parent. The value of these loans and the interest and services transactions are included in these data and are classified by country of the FAFP.