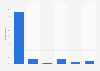
| Latest available time period in brackets | Male | Female |
|---|---|---|
| France (2009) | 133 | 130 |
| Denmark (2001) | 118 | 120 |
| Italy (2008) | 117 | 112 |
| Portugal (1999) | 116 | 108 |
| Japan (2011) | 104 | 117 |
| Belgium (2005) | 104 | 107 |
| Korea (2009) | 107 | 103 |
| China (2008) | 104 | 96 |
| Germany (2001-02) | 97 | 101 |
| Poland (2003-04) | 90 | 91 |
| Australia (2006) | 87 | 91 |
| Slovenia (2000-01) | 89 | 83 |
| India (1999) | 87 | 80 |
| Norway (2010) | 83 | 80 |
| Finland (2009-10) | 80 | 81 |
| New Zealand (2009-10) | 79 | 80 |
| Estonia (2009-2010) | 82 | 77 |
| Austria (2008-09) | 77 | 81 |
| Ireland (2005) | 78 | 75 |
| South Africa (2010) | 76 | 69 |
| Sweden (2010) | 70 | 74 |
| Mexico (2009) | 71 | 70 |
| Netherlands (2005-06) | 61 | 70 |
| Spain (2009-10) | 66 | 61 |
| United States (2014) | 63 | 61 |
| Canada (2010) | 61 | 58 |
| United Kingdom (2005) | 59 | 59 |
The chart is not accessible to screen readers. Please switch to the table view to access the data.
Loading statistic...
Download
Source
Source
Release date
March 2016
More information
Region
China, India, South Africa, OECD
Survey time period
1999 to 2014
Age group
15-64
Method of interview
Questionnaire
Supplementary notes
Figures are based on numbers collated by the OECD from the various national time use surveys of the countries included in the statistic.
Data are normalized to 1440 minutes per day. In other words, for those countries for which the time use does not sum up to 1440 minutes, the missing minutes are equally distributed across all activities.
Age group is 15-64 for all countries but Australia (15+), Hungary (15-74), Sweden (25-64) and China (15-74).
*Hungary and Turkey were excluded as no data was available
Citation formats