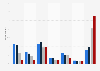
| Characteristic | Every day | Most days | Once a week | Once a month | Less often |
|---|---|---|---|---|---|
| - | - | - | - | - | - |
| - | - | - | - | - | - |
| - | - | - | - | - | - |
| - | - | - | - | - | - |
| - | - | - | - | - | - |
The chart is not accessible to screen readers. Please switch to the table view to access the data.
Download
Source
Source
Release date
September 2016
More information
Region
United Kingdom
Survey time period
2016**
Number of respondents
595 respondents
Age group
18 years and older
Special properties
All adults personally using Netflix
Method of interview
Online survey
Supplementary notes
**Wave 5 (2016 H1) ran January to June 2016.
in 2016, the survey moved to a 6-monthly reporting cycle.
Citation formats