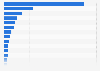
| Characteristic | Hospitalizations per 100,000 population |
|---|---|
| 2022 | 555 |
| 2021 | 559 |
| 2020 | 560 |
| 2019 | 591 |
| 2018 | 601 |
| 2017 | 599 |
| 2016 | 601 |
| 2015 | 602 |
| 2014 | 609 |
| 2013 | 624 |
| 2012 | 618 |
| 2011 | 618 |
| 2010 | 619 |
The chart is not accessible to screen readers. Please switch to the table view to access the data.
Loading statistic...
Download
Source
Source
Release date
July 2024
More information
Region
Canada
Survey time period
2010 to 2022
Special properties
age-standardized
Supplementary notes
Release date represents the date figures were accessed.
* Number of hospitalizations for Canada includes Canadian residents from unknown provinces. Results for Nunavut have been suppressed due to incomplete 2016鈥�2017 data. Statistics Canada鈥檚 2011 population estimates were used to calculate the above age-standardized rates. Excludes poisoning cases.
Fiscal years from April 1 to March 31.
Citation formats