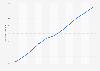
| Characteristic | Number of average available hospital beds |
|---|---|
| 1998/99 | 190,006 |
| 1999/00 | 186,290 |
| 2000/01 | 186,091 |
| 2001/02 | 184,871 |
| 2002/03 | 183,826 |
| 2003/04 | 184,019 |
| 2004/05 | 180,966 |
| 2005/06 | 175,436 |
| 2006/07 | 167,019 |
| 2007/08 | 160,891 |
| 2008/09 | 160,254 |
| 2009/10 | 158,461 |
| 2010/11* | 144,455 |
| 2011/12 | 137,354 |
| 2012/13 | 137,287 |
| 2013/14 | 136,459 |
| 2014/15 | 135,754 |
| 2015/16 | 131,812 |
| 2016/17 | 131,282 |
| 2017/18 | 130,297 |
| 2018/19 | 128,589 |
| 2019/20 | 128,407 |
| 2020/21 | 118,473 |
| 2021/22 | 123,922 |
| 2022/23 | 129,575 |
| 2023/24 | 130,048 |
| 2024/25 | 131,875 |
The chart is not accessible to screen readers. Please switch to the table view to access the data.
Loading statistic...
Download
Source
Source
Release date
September 2024
More information
Region
United Kingdom (England)
Survey time period
Q1 2010/11 to Q1 2024/25
Supplementary notes
This statistic is compiled from multiple reports from the same source found .
Figures include general & acute, learning disabilities, maternity, and mental illness beds. Figures are for overnight beds only. Excludes day only hospital beds. Figures are for consultant-led beds only.
*From 2010/11 data collection changed, quarterly data were reported. Q1 figures were taken for each year.
Citation formats