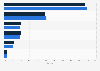
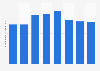
| Characteristic | CPG expenditure in U.S. dollars per trip |
|---|---|
| - | - |
| - | - |
| - | - |
| - | - |
The chart is not accessible to screen readers. Please switch to the table view to access the data.
Download
Source
Source
Release date
June 2015
More information
Region
United States
Survey time period
November 2014
Number of respondents
1,442 respondents
Age group
18 years and older
Special properties
Asian-American respondents
Method of interview
Online survey
Supplementary notes
* This project was conducted in two stages. First, an online English-language survey was given to a general population (White, African-American, Hispanic and Asian-American) sample of 5,028 respondents 18 years or older, weighted by gender, age, and race. Second, oversamples were conducted with 1,442 Asian-American respondents; oversamples were conducted entirely online and in English. The goal of this study was to see 鈥渨ho spends what, and where, and with what payment method鈥� on a solid empirical grounding. Verticals analyzed included: Retail/Specialty Retail, Telcom/Financial, Restaurant (Fast Food/QSR and Casual Dining), Consumer Packaged Goods (CPG) and Travel/Entertainment.
Citation formats